Rural Economic Benefits of Climate Policy
An important tool for climate policy outreach, especially to conservatives, is the significant economic boost to rural areas that stems from the buildout of wind and solar energy. CCL has derived estimates of the annual revenues that would accrue to congressional districts and states as a result of one sample climate policy.
Background
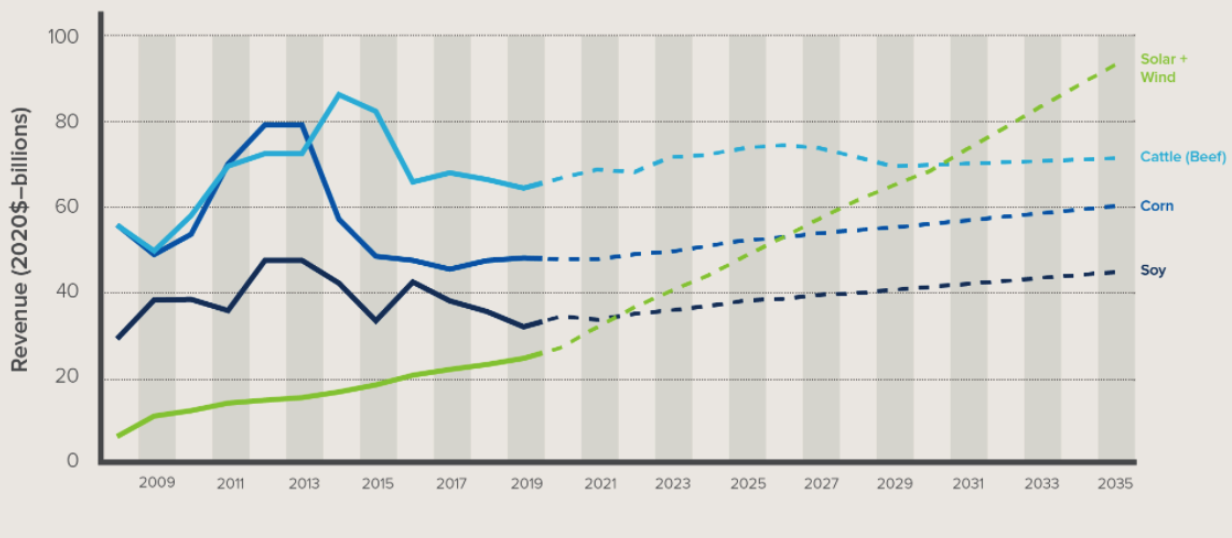
As described in an extensive report by RMI, an independent, non-partisan consultancy, policies that would reduce carbon emissions, including carbon pricing, would significantly boost American rural economies. Such a policy would increase investment in utility-scale wind and solar power in the U.S., and up to 99% of these renewable projects would be sited in rural communities. If climate policies are sufficiently ambitious[i], total revenue from wind and solar projects would rival those from major cash crops (beef, corn, and soy) by 2030 and exceed them thereafter. This revenue would be as stable as electricity usage, generating a far more consistent source of needed income for these communities than products subject to commodity price fluctuations.
The buildout of renewable energy would generate a consistent source of revenue simply from constructing, hosting, and operating the wind and solar energy facilities. This would generate four clear sources of stable revenue for the rural communities:
· Tax payments: local taxes from wind and solar projects would allow town and county governments to invest more in public services and school districts or to lower other taxes.
· Land lease payments: rural landowners will make money leasing portions of their property for wind and solar projects.
· Construction wages: the construction of the wind and solar projects will bring significant job creation and wage revenue to the communities hosting the projects.
· Operations and maintenance (O&M) wages: an O&M workforce will be needed to support new wind and solar capacity on an ongoing basis, also yielding significant job creation and revenue.
Estimates of Direct Annual Revenue for Rural Communities
The National Renewable Energy Lab (NREL) has constructed a set of highly detailed models that evaluate the cost of generating wind or utility scale solar power in over 250,000 locations in the continental U.S. With this information, estimates can be derived as to the amount of renewable energy capacity that can be installed and electricity produced within a given area as a result of a specified policy that encourages renewables, such as a carbon tax. These estimates assume that the lowest-cost solar and wind projects are developed first[ii].
CCL hired University of Pennsylvania Research Affiliate Kevin Ummel to utilize these state-of-the-art models to generate estimates of how much direct annual revenue would accrue to each congressional district under a climate policy scenario that most resembles a carbon tax. He describes the scenario as follows:
“The most aggressive decarbonization scenario currently available in Cambium [an NREL model] is the “Lower RE Costs, High Electrification” scenario developed for the Electrification Futures Study (EFS). It pairs lower-cost renewable energy technology with an increase in electricity demand (e.g. adoption of electric vehicles). The least-cost solution in this scenario includes large-scale build-out of wind and solar technology and results in power sector CO2 emissions falling ~62% between 2020 and 2034. Although this scenario does not include explicit carbon pricing, by assuming lower renewable power costs (relative to fossil fuels) it likely reflects the key supply-side effects of aggressive carbon pricing.”
 In this particular EFS scenario (link here), renewable energy capacity expands from 212 gigawatts (GW) of electricity in 2020 to 982 GW in 2034; an almost fivefold increase. The average direct revenue to rural communities from adding this 760 GW of electric capacity is $17.3 billion every year (see graphic, right). This is comprised of the following:
· $6.5 billion in local tax payments,
· $3.4 billion in land lease payments,
· $3.9 billion in construction wages, and
· $3.5 billion in O&M wages.
Total Economic Benefit to Rural Communities
It’s important to understand that the total economic benefit to these rural communities includes this direct revenue plus indirect benefits, and so would be several times the $17 billion. The reason is that most of the $17 billion in new revenue is then spent in these communities, and this generates additional economic activity. For example, the tax revenue is either spent on new schools or roads, generating additional wages and other revenue, which is also then spent or used to lower other taxes (i.e., sales or property taxes). This leaves more money in the community for residents to spend on other products. Similarly, the construction and O&M wages reflect the additional jobs and revenues that flow through the local economy, and this money is then spent on food, housing, and the like, which generates additional jobs and revenue. Though the indirect revenues are not easily estimated, the total revenue increases to rural communities should be several times the direct benefits.
Notes on Our Advocacy
 There are two more important elements of this analysis that are pertinent to our advocacy. First, congressional districts that are represented by Republican lawmakers receive the overwhelming majority of these financial benefits. Because they accrue to rural areas, and predominantly rural areas are more often represented by Republicans, congressional districts represented by Republicans receive 82% of the direct annual revenue (see graphic, right). Advocates to conservatives: take note, as this information may be especially useful in your efforts.
Second, as reflected in the Columbia Report modeling the Energy Innovation and Carbon Dividend Act, at least for the first 10 years and possibly longer, the increase in renewable energy capacity does not reduce the production of either US natural gas or oil (see the section titled Energy Production Implications). This is because the new wind and solar energy primarily replace coal production and imported oil. Representatives concerned about the loss of natural gas or oil production should be made to understand this.
Tools for Advocacy
To facilitate the use of this information in our advocacy, CCL has compiled a set of tools. (Note that results are not generated for the 126 congressional districts[iii] that have no renewable buildout in this scenario and so no direct economic benefit[iv].) For each of these districts volunteers have access to the unique 2-page “leave behind” reports listed above that provides a description of the rural economic benefit and the estimate for that specific area and the CCL Training page that describes the estimates, how they were produced, and how to utilize them in advocacy.
Further questions should be directed to jerry@citizensclimatelobby.org.
Footnotes
[i] This statement, from the RMI study linked above, utilizes a scenario from the 2035 Report, a report released in 2020 by UC-Berkeley and GridLab that assessed the potential for the U.S. grid to be reliably powered by 90% carbon-free energy in 2035.
[ii] Actual results will differ somewhat, especially as it will be up to the individual landowners to decide what they do with their land. Assuming firms and people always act to optimize financial wellbeing is usually necessary to conduct the modeling, but things are less simple in reality.
[iii] For example, 160 congressional districts were estimated to have no increase in renewable energy capacity as a result of the policy.
[iv]For States we used Annual Income greater than or equal to 0.05% of GDP as a threshold, whereas for congressional districts we used Annual Income greater than or equal to 0.09% of Total Household Income.
FAQ Section:
1. Why is so much renewable energy being sited in rural areas?
Simply stated, a wind or utility scale solar farm needs a bit of room, so they do not fit well in suburban or urban areas. Further, roughly 97% of the US land mass is in areas defined as “rural.” If an investor is going to build a renewable energy farm, it will almost certainly be in a rural area.
2. What kind of uncertainty is behind the term “up to 99%?”
According to consultancy RMI, rural areas “host 99 percent of onshore wind and a growing share of utility-scale solar projects.” Going forward, we cannot be certain where the energy farms will be located, but the vast majority will almost certainly be where there is substantial room for the facilities.
3. Why is roughly 80% of the new renewable capacity built in Republican Congressional Districts?
At least over the past few decades, rural areas in the US tend toward center-right on the political spectrum and so are more often represented by Republicans. As such it makes sense that more of the economic benefits would accrue to Republican-held congressional districts. That it was 82% in this particular instance was simply a matter of the scenario that estimates 770 gigawatts (GW) of capacity would be built and which party held the swing congressional districts as of the 2020 elections.
4. Do these estimates reflect the likely outcome of EICDA or a carbon tax generally? If not, would EICDA yield more renewables and revenue to rural communities or less?
We believe this EFS scenario is as close to the renewable buildout that would result from a strong carbon tax as is currently available within these state-of-the-art NREL models. The EFS Low RE (renewables) Cost, High Electrification scenario combines two drivers that could result from a carbon fee. First, there is a strong increase in demand for electricity from the transport, industrial and buildings sectors. Because electrification in these sectors is a key way to reduce emissions (e.g., EV cars, electric space and water heating in buildings) when generated from clean sources, a carbon tax would yield greater electrification.
Second, a future in which renewable costs decline more than expected is akin to one in which the alternative, energy from fossil fuels, rises more than expected due to the pollution fee. So the EFS scenario has clear similarities to a strong carbon fee.
Regardless, these estimates are based on a scenario in which US wind and solar generating capacity increases from 220 GW in 2020 to 990 GW in 2034, and that is the sole source of the economic benefit (i.e., annual revenue) being estimated. We don't have explicit data on the increase in wind and solar over 14 years that would stem from enactment of the EICDA, but rough comparisons from the 2014 REMI Study and the Columbia Report indicate that the increase of 770 GW of wind and solar over 14 years is in the ballpark.
5. How does the model know where wind and solar projects will be located?
As discussed in this description of the analysis, the primary driver of where the wind or solar farm is located is the all-in cost of generating electricity in that location. However, other factors are considered as well, including “matching of supply and demand across time and space; feasibility and cost of transmission, seasonal and diurnal uncertainty of wind and solar power (i.e., intermittency), and maintenance of grid reliability.” So, 57,000 wind sites and 203,000 solar sites are evaluated both for the cost of generating electricity, the need for that electricity, and the feasibility of building and operating the farm on that site.
6. What are the key sources of uncertainty in the rural economic benefit estimates?
Two things bear mentioning here. First, renewable farms will not always be sited strictly as a function of cost (though it is difficult for modelers to assume anything else). The author of this analysis states that “Local siting constraints, regulations, and zoning could have a significant impact on the amount of technology ultimately deployed in different places.” Included in this will be politics: whether landowners and locals want to have the farm on or near their property (NIMBY concerns). Second, that the EFS scenario will differ in some respects than a carbon price, though it is not clear whether renewable capacity will increase more or less as these factors may offset. The carbon tax will likely discourage fossil fuels, especially coal, even more than in EFS because it is a direct charge on the corresponding pollution. However, a critical feature of a pollution fee is that it incentivizes energy efficiency measures and conservation in general. Under a carbon price, more of the energy mix should be renewable or nuclear, but there would be less energy produced overall.
7. How does the EFS scenario differ from a strong carbon tax?
The EFS scenario will differ in some respects from a carbon price, though it is not clear whether renewable capacity will increase more or less as these factors may offset. The carbon tax will likely discourage fossil fuels, especially coal, even more than in EFS because it is a direct charge on the corresponding pollution. However, a critical feature of a pollution fee is that it incentivizes energy efficiency measures and conservation in general. Under a carbon price, more of the energy mix should be renewable or nuclear, but there would be less energy produced overall.
8. Why do we state that total economic benefits will be several times the direct benefits?
RMI has stated that “indirect benefits” are between two and eight times the direct benefits (average annual revenue) for the state or congressional districts, though what it will be for a particular congressional district is very difficult to estimate. Indirect benefits come about when the direct benefits, the annual revenue from the four sources, is spent in the congressional district or state, as this serves as an additional form of revenue. For example, if the tax revenue is spent on improving roads or schools in the congressional district, much of this money will go to hire workers and buy material within the congressional district, creating another source of revenue. If these new workers spend the wages on housing and food in the congressional district, this becomes another revenue stream, etc. Alternatively, if the tax revenue is used to reduce other taxes such as sales or property taxes, this puts additional money in the pockets of consumers in the congressional district. A portion of the money will be spent in the congressional district, creating another revenue stream.
9. To construct the revenue estimates, do we actually know the tax, construction and O&M wage, and land lease rates for each congressional district?
We do not have this level of detail by congressional district, but we do have it for each state. The tax rates, lease and wage rates within each state are used for each congressional district within the state. This reflects a simplification of the model, but one made necessary by a lack of congressional district-level data.
10. Why is the focus of the estimates on Average Annual Revenue over this 14 year period?
Revenue from a wind or solar farm buildout will be uneven over time. Manufacturing wages and land lease payments will begin at the inception of the project. Once it is built, revenue will accrue from all sources except manufacturing wages. As such, focusing on the average annual revenue metric was chosen to smooth the revenue flows.
To give enough time for the renewable buildout to take hold, CCL wanted to use a period of a decade or more. In RMI’s study, they focused on the amount of average annual revenue to each state over the 30-year expected life of the solar and wind farm. CCL felt this was too long a period, as the typical MOC is more interested in more near-term results. The 14 year period seemed both short enough and long enough.
11. Why don’t all congressional districts and states have the two page handout?
Regarding states, all have reports except Alaska and Hawaii as the NREL models simply did not evaluate those states. Regarding congressional districts, in 126 of the 433 areas (again, Alaska and Hawaii excluded), it is estimated there would be no additional solar or wind buildout in this scenario. As a result, the rural economic benefit (annual revenue) would be zero, and so no report was produced. Generally, this is the case either because 1) the congressional district is a small urban area or 2) there simply is inadequate sun or wind energy resources. Some of these congressional districts might attract wind or solar projects if the demand for clean energy was even greater than the amount in this scenario.
12. Regarding rural economies, what is the total annual revenue from the major agricultural cash crops and how does it compare to the total revenue from renewable energy?
The amount of total revenue from renewables is substantial, will grow dramatically with climate policy, and could soon rival and exceed that of the major agricultural crops. The RMI Report illustrates this with the below graphic. Under RMI’s scenario where the US utilizes 90% clean energy by 2035, which is right in line with the EFS scenario utilized for this analysis, total renewable revenue matches or exceeds that from each of the major products by 2030.
However, not all of this revenue will go directly to the rural community that houses the renewable energy farm. For example, if the wind turbines and solar panels likely were built outside the congressional district.
Our Rural Economics Benefits analysis focuses only on the revenue directly accruing to those communities (see next FAQ).
13. Why is the total revenue from renewable energy so much more than the average annual revenue estimated for these rural economies?
Total revenue is the cost of electricity multiplied by the amount used. This revenue is used to compensate for the costs of the production and distribution of the electricity plus return on investment (profit), but some of these costs are either not incurred in the congressional district or are not a result of the renewable buildout. For example, much of the material for the energy farm (solar panels, wind turbines) likely comes from outside the congressional district. Much of the infrastructure for distribution of the electricity (e.g., the grid) as well as the administration and management of providing and serving the electricity (costs borne by the electric utility) are largely already in place, so there will not be additional revenue stemming from the renewable farms. As such, though total revenue from renewables may grow to $60 and $80 billion per year over time, the additional direct revenue stemming from the renewable buildout that accrues to the rural community can average around $17 billion a year over this period. Again, the total economic benefit, including direct and indirect benefits, will be several times this amount.
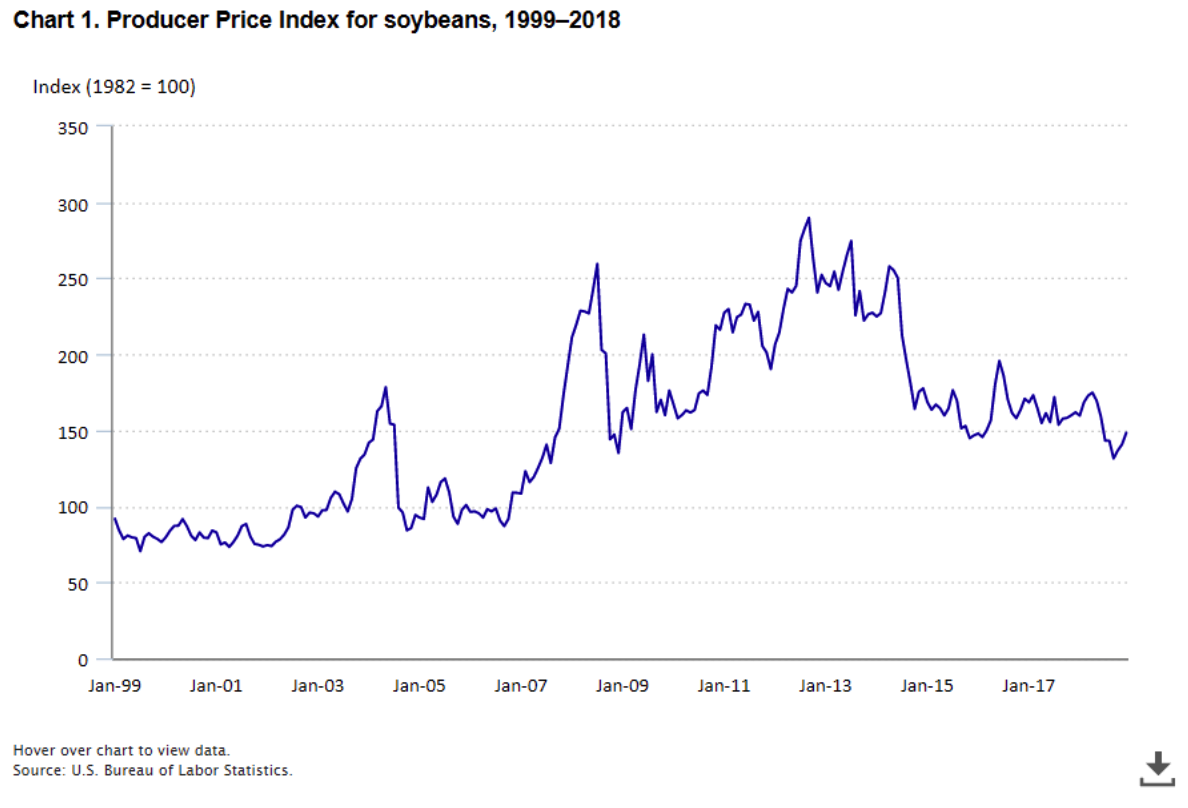
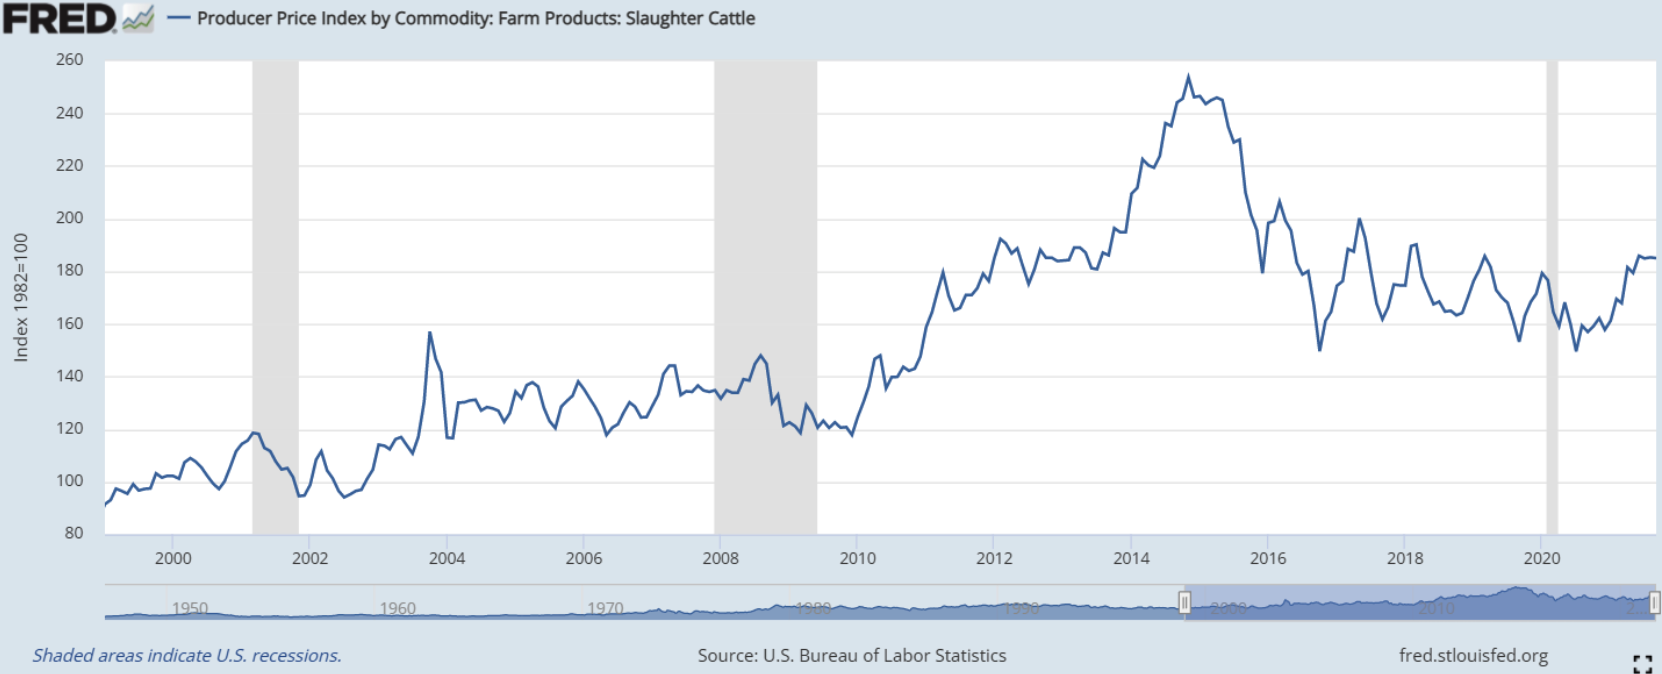
14. Can you give us a sense of the variability that farmers must deal with in respect to global commodity prices?
The charts for soybeans and cattle from 1999 to present, below, give an indication of price volatility. Typically, the costs to produce these products do not vary as significantly or in the same direction, so this variation can translate to windfall gains when prices rise or to losses when they fall. Larger farmers can use futures markets to hedge these swings (see charts below from the US Department of Labor and the Federal Reserve Economic Data (FRED)), but farm profitability is generally volatile. The revenue from renewable energy should be far more stable.
Earlier research and maps on clean energy progress
The U.S. Clean Energy Progress Map from the Environmental Defense Fund shows the economic impact of clean energy growth across the country. The map is a non-partisan public resource that captures investments and jobs in the U.S. wind, solar and energy efficiency industries. Social science research reminds us of the importance of tying the impacts of climate change to our local communities. The Clean Energy Progress Maps, from the Environmental Defense Fund (EDF), helps advocates make this essential connection.
To learn how to use this tool and to incorporate it into your climate advocacy, watch this 2018 CCL tutorial (16m 28s) with James Fine, EDF’s Senior Economist.