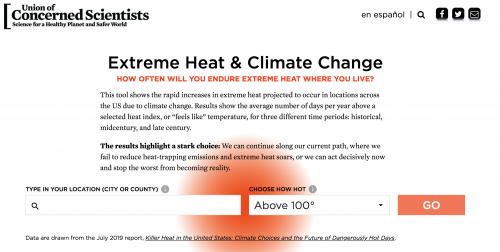
Extreme Heat & Climate Change
Description
This tool shows the rapid increases in extreme heat projected to occur in locations across the US due to climate change. Results show the average number of days per year above a selected heat index, or “feels like” temperature, for three different time periods: historical, midcentury, and late century.
Go Deeper
A link to the Sept. 5th webinar recording will be posted here afterwards.
Click on the image below to be directed to the online Union of Concerned Scientists Extreme Heat Resource.

Click here for the Extreme Heat video tutorial overview with one of the report's co-authors (21 min)

Note that data for the historical period reflect the annual average for all years between 1971 and 2000. For any given location, some years during that time period may have had more extreme heat days than reported here while others had fewer. Because extreme heat has increased since that historic period, places included in this tool may have experienced more frequent extreme heat in recent years than during the historic 30-year average.
Category
Resource
Topics
Climate Science