Columbia University's Assessment of the Energy Innovation Act
This training explores the main findings behind Columbia University’s Center on Global Energy Policy “An Assessment of the Energy Innovation and Carbon Dividend Act” and what CCL volunteers should know about the study.
Main Findings
A group of five economists from Columbia University’s Center on Global Energy Policy in October 2019 published, “An Assessment of the Energy Innovation and Carbon Dividend Act.” This study offers an up-to-date, independent assessment from a prestigious institution of the Energy Innovation Act’s impacts on emissions, air pollution and Americans’ finances. It confirms that the Energy Innovation and Carbon Dividend Act is effective at reducing emissions and is good for people’s health and their pocketbooks. CCL is encouraged that more attention on the bill will generate more support for this crucial policy.
The Columbia study provides new data specific to the Energy Innovation Act. Until now, CCL’s understanding of the bill’s impacts has been mainly based on a previous evaluation of carbon fee and dividend-style policy conducted by REMI in 2014 and on the language in the bill itself.
The study’s key findings include:
- Substantial emissions reductions. The authors conservatively estimate that the Energy Innovation Act will drive 36% to 38% emissions reductions by 2030. This exceeds the U.S. commitments to the Paris Agreement over this period. This decline in emissions happens because the policy will shift the U.S. economy from carbon-intensive energy sources to low- and zero-carbon energy sources.
- The study confirms that the bill will be good for people.
- Good for their health: The study finds that, under the Energy Innovation Act, sulfur dioxide (SO2) and mercury emissions from the power sector will decline by more than 95% and nitrogen oxide (NOx) emissions will decline by about 75% by 2030. The authors state, “as lower-income and minority households suffer disproportionately from the impacts of air pollutants, they are likely to benefit disproportionately from pollution mitigation.”
- And good for their finances: The Energy Innovation Act generates substantial revenue that is distributed in the form of equal dividend payments each month. Most people benefit financially from this policy. Adults will be receiving dividends totaling, annually, $250-$260 in 2020 and $1,410- $1,470 in 2030 (half those amounts are also paid to each child). The study explains, “On average, the carbon dividend payments are comparable to the changes in energy expenditures caused by [the Energy Innovation Act]. Because higher-income households purchase far more carbon-intensive goods and services, distributing dividends equally implies that average low- and middle-income households receive more in dividends than they pay in increased economy-wide prices for goods and services resulting from the carbon tax.”
- Economic consensus. The economists at Columbia who conducted this study are experts in their field. Economists are broadly united in supporting a price on carbon. The study states, “A price on carbon is a uniquely cost-effective policy tool because it incentivizes emissions reductions wherever and however they can be achieved at the lowest cost. That is why economists almost universally support putting a price on carbon.”
Dr. Noah Kaufman, one of the study’s authors, points out that “it’s no secret that a price on carbon is a critical part of low-cost climate change strategy, but crafting carbon tax legislation requires policymakers to make a host of difficult choices. We hope our studies enable a better understanding of the benefits and trade-offs of different policy design options.”
Similarities across recent legislation
Columbia University’s Center for Global Energy Policy (CGEP) also has published an earlier analysis comparing it to other carbon fee plans that have been proposed recently when the Energy Innovation Act was introduced. Specifically, the analysis compares Rep. Deutch’s new Energy Innovation Act to the American Opportunity Carbon Fee Act authored by Senator Whitehouse and others (Whitehouse), the Market Choice Act authored by Representative Fitzpatrick this session (Curbelo), and the plan forwarded by the Climate Leadership Council (Baker). The analysis highlights the differences between Rep. Deutch’s Energy Innovation Act and others, and also uses analysis of these and other revenue-neutral carbon fee (RNCF) programs to indicate the likely economic and environmental impacts of the Energy Innovation Act.
There are three key similarities between the plans:
1. They are “economy-wide” in the emissions covered, 90% of net greenhouse gas (GHG) emissions fall under the plan.
2. To minimize the number of entities taxed, the fee is collected upstream.
3. All plans have a border carbon adjustment (BCA) in order to avoid diminishing the competitiveness of emission-intensive, trade-exposed industries.
Key differences
The first key difference pertains to the level of the carbon fee. As demonstrated in Figure One below from Columbia’s analysis, Deutch’s Energy Innovation Act starts the carbon fee lower but increases much more quickly. The Market Choice Act would start at $24 and rises at 2% each year, the Whitehouse-Schatz proposal would start at $50 and rises at 2%. The Baker-Shultz plan would start at $40, and has not specified a rate of increase, though it is assumed to rise at 4% for this analysis.
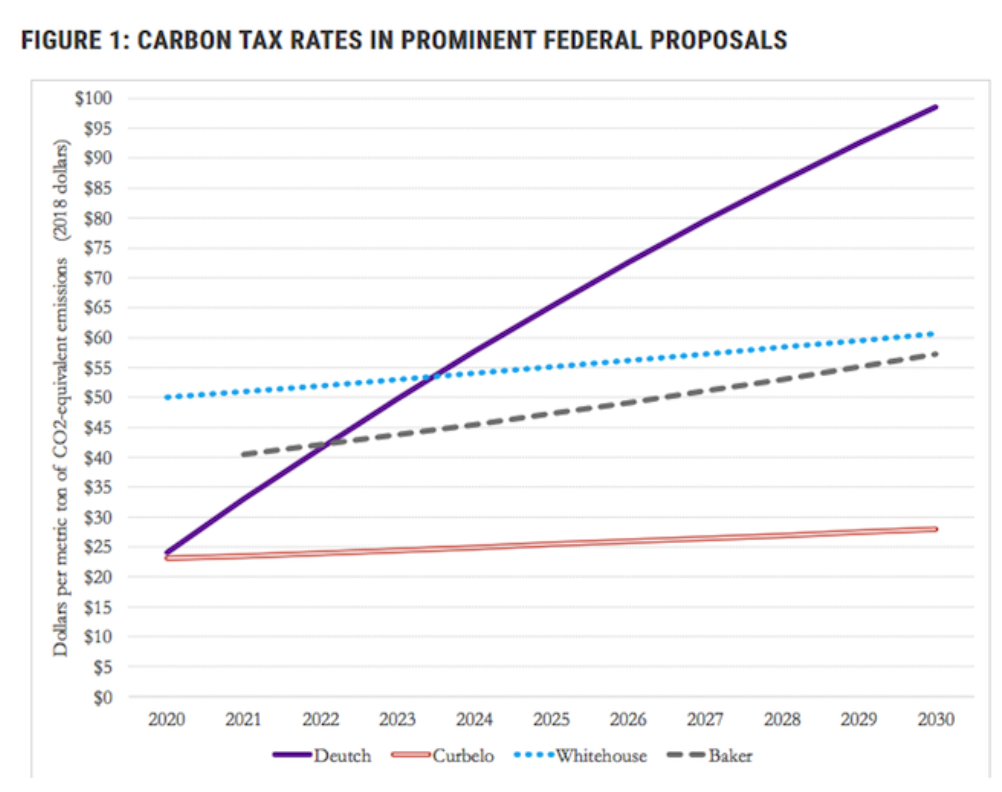
As a result, the Energy Innovation Act’s fees are much higher by 2030, and the gap would continue widening. The bill also has a provision to raise the annual fee increase to $15 if emission reduction targets are not met. In all, the Energy Innovation Act reflects a much stronger escalating rate for a carbon fee and a much higher total price per ton of carbon dioxide equivalent (CO2e) emitted by 2030 than recent proposals. Note: This assumes a 2% rate of inflation, which reflects the Federal Reserve’s inflation target.
Also, the Baker Proposal has not been formally proposed. A 2018 Climate Leadership Council report designated the carbon tax rates displayed above as its “mid-point” pathway.
The second difference, as depicted in Figure 2 below, pertains to what is done with the revenue. Though Deutch’s Energy Innovation Act and the Baker plan both return all funds to consumers, the Curbelo bill largely funds infrastructure spending (the bill abolishes the federal gas tax) and the Whitehouse bill lowers the portion of the payroll tax paid by employees. Both of these plans also provide targeted funds to the poor to offset rising costs.

The third difference, as depicted in Table 1 below, pertains to regulatory changes. Of greatest significance, Deutch’s Energy Innovation Act puts a moratorium on the regulation of emissions that are subject to the carbon fee, but only as it pertains to their GHG effects. All other EPA authority over fossil fuel pollution and impacts that have components unrelated to GHG potential is retained. This includes retention of programs like vehicle fuel efficiency standards and methane abatement rules for oil and gas field operations. In addition, the Energy Innovation Act restores GHG regulatory authority if emissions targets have not been met after 10 years. While the Curbelo plan has a similar provision, Whitehouse retains all regulations, and Baker eliminates GHG regulations entirely. Only the Baker plan eliminates tort liability for emitters.
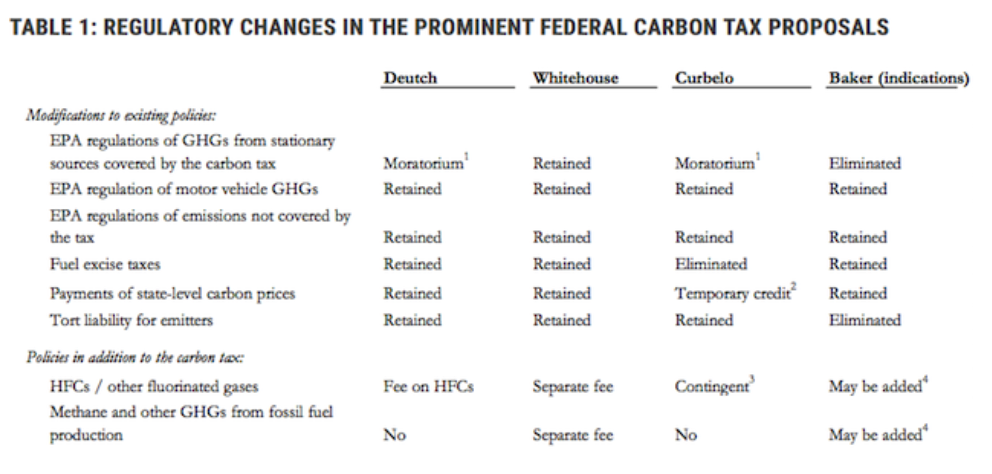
Table Notes:
1) Regulations are eliminated as long as emissions targets stipulated in the proposed legislation are achieved.
2) A temporary and declining credit against any carbon price paid at the state level, as in California or the RGGI states, that phases out after five years.
3) The carbon tax covers hydrofluorocarbon (HFC) emissions if the United States has not ratified the Kigali Amendment to the Montreal Protocol.
4) The Climate Leadership Council has indicated that it intends to propose measures that cover non-CO2 greenhouse gas emissions (Climate Leadership Council 2018).
Emissions and economic impacts
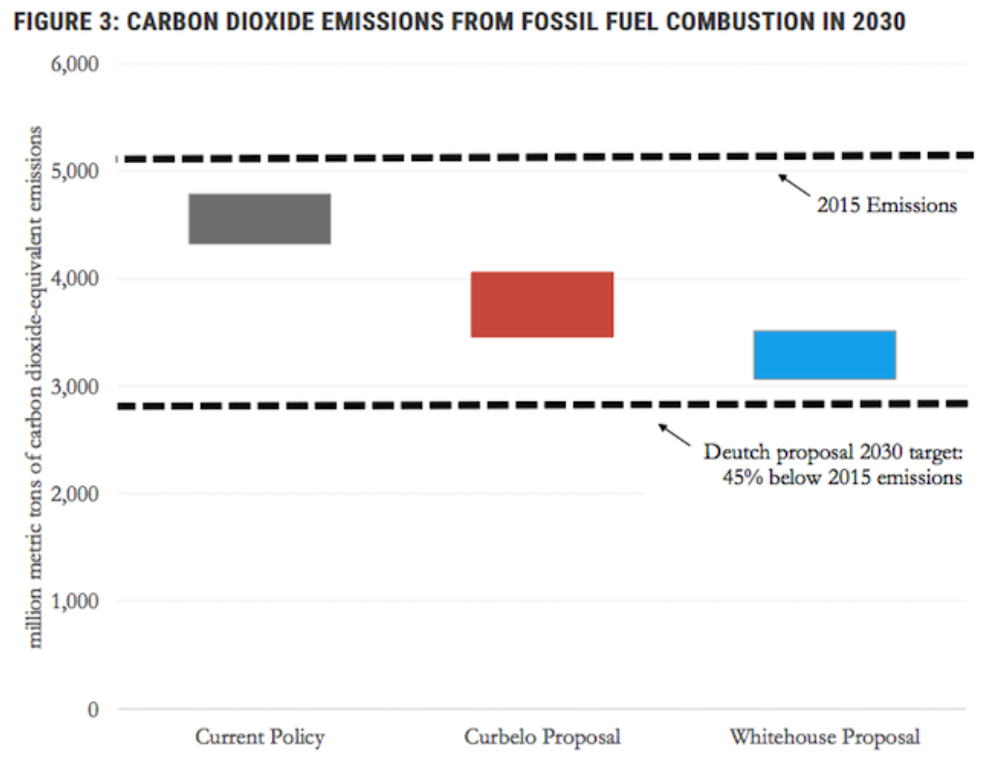
Because the Energy Innovation Act was just introduced, there has been insufficient time to conduct a detailed analysis of its impacts, but they can be inferred from analysis of similar RNCF plans evaluated in the recent past. Specifically, CGEP has conducted modeling of both the Curbelo and Whitehouse plans (One of the scenarios evaluated in this analysis is a RNCF that begins at $50 and rises 2% a year, just as the Whitehouse bill does). While the Baker plan has not been subject to similar economic analysis, because its carbon fee falls in between these two, the emissions impacts should fall there as well.
Figure 3 from the Columbia analysis, below indicates the estimated emissions reductions by 2030 for the non-policy scenario and the two bills. Note that reductions are depicted by a band, not a point, to reflect the uncertainty inherent in the estimate. By 2030, emissions decline slightly without any fee in the current policy scenario, and further reductions are determined by the strength of the carbon fee. Importantly, the Columbia analysis estimates that the Energy Innovation Act “likely” achieves the target of reducing emissions at least 45% below 2015 levels by 2030. Its rationale is that “projected emissions under the Whitehouse proposal bring emission levels 65 to 90 percent of the way to this 2030 target [of reducing emissions by 45%], and the Deutch Proposal’s carbon tax rates are over 60 percent higher (in inflation adjusted terms) by 2030.” This means that in 2030 (if the policy was adopted in 2019), the Deutch carbon fee would be $125 in addition to inflation or over 60% higher than the estimated Whitehouse price of approximately $77 in 2030. CGEP’s point is that if the Whitehouse carbon fee yields reductions that are 65% to 90% of the emission reduction goal, a price 60% higher should cause reductions that are at least 100% of the goal.
Regarding macroeconomic impacts, the Columbia analysis notes:
- A carbon fee “leads to better economic outcomes” (i.e., is more efficient) than regulatory approaches.
- When revenue is distributed to households, as in the Deutch and Baker plans, the policy is progressive, so that “low-and middle-income households would receive more in rebates than they pay in taxes…”.
- Returning the funds to households is not as stimulative as using the funds to reduce tax rates, such as the payroll tax cut in Whitehouse.
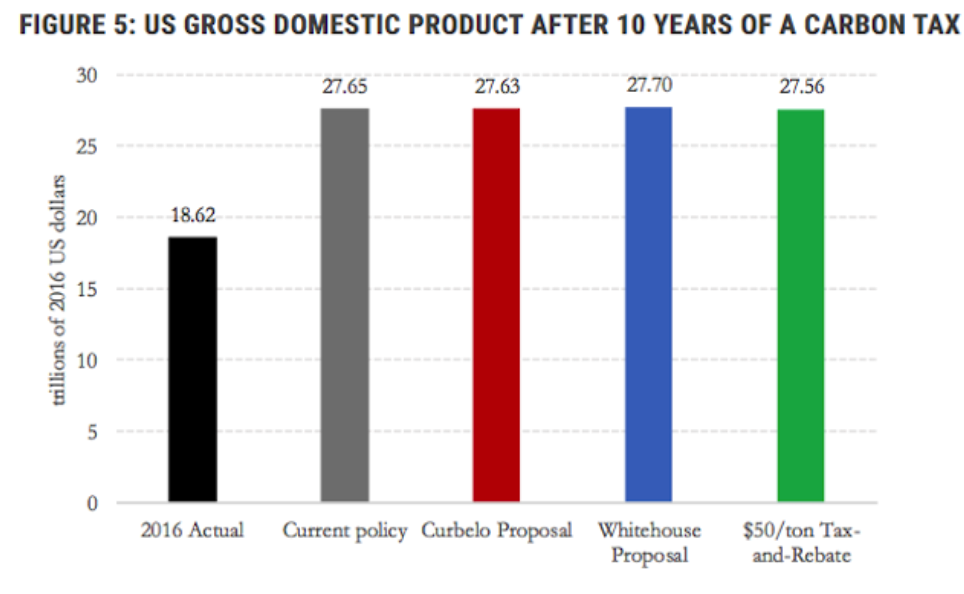
Finally, the estimated impacts to the United States Gross Domestic Product (GDP) are shown below in Figure 5 and are very minor. The Columbia analysis shows the Whitehouse bill, featuring labor tax cuts, adds slightly to GDP by 2030. The Curbelo bill, featuring investment in infrastructure, essentially breaks even. While Deutch’s Energy Innovation Act has not yet been evaluated, a RNCF plan that mirrors the Whitehouse fee schedule, but returns all funds to households, lowers the GDP growth rate from approximately 3.03% to 3.00% per year (roughly $6B of a $19,390B economy). This estimated impact is far less than 1) the annual health costs of GHG pollution, 2) the ever increasing costs of climate related damages, and 3) the cost of regulating carbon via regulation. For example, the EPA has estimated the economic cost of regulating carbon via the Clean Power Plan at between $7B and $14B a year.
Intro & Agenda
(from beginning)
Emissions Impacts
(8:13)
Energy Production & Prices Impacts
(15:04)
Government Revenues
(20:01)
Impacts Beyond The Assessment's Scope
(24:29)
Comparison To Other Proposals
(27:39)
- Noah Kaufman
- Download PowerPoint or Google Slides presentation.
- Download the video.
Intro & Agenda
(from beginning)
Emissions Impacts
(8:13)
Energy Production & Prices Impacts
(15:04)
Government Revenues
(20:01)
Impacts Beyond The Assessment's Scope
(24:29)
Comparison To Other Proposals
(27:39)
- Noah Kaufman
For further reading outside CCL on carbon tax economic analysis: