The Household Impact Study
This training walks through the Household Impact Study (2020 Updates), a paper that assessed the net financial impact of The Energy Innovation & Carbon Dividend Act on U.S. households across each state and congressional district as well as what percentage of people would receive more money from the dividend than they see in increased expenses from the carbon fee (and by how much).
The Financial Impact on Households
- Link to the Full Household Impact Study Report
In August 2020, Citizens’ Climate Education (CCE) and Citizens’ Climate Lobby (CCL) released a working paper that projects how U.S. households will fare financially under the Energy Innovation and Carbon Dividend Act of 2019 (H.R.763). This document, entitled “The Impact of a Carbon Fee and Dividend Policy on the Finances of U.S. Households,” is a follow-up to a 2016 study that had preceded the drafting of legislation in 2018.
H.R.763 imposes a fossil fuel carbon fee at $15/metric ton of CO2-equivalent, and then distributes all the net proceeds to eligible U.S. residents on a per-capita basis as monthly Carbon Dividends. Adults receive full shares and children receive half-shares. Because of enduring interest from members of Congress in how their constituents would fare under the policy, CCE and CCL commissioned independent researcher Kevin Ummel to conduct this analysis. Mr. Ummel, a Research Affiliate at the University of Pennsylvania and President of Greenspace Analytics, had previously authored the 2016 study.
The new study aligns with the legislative language of H.R.763 and uses the most recent available economic and emissions data. It also incorporates methodological improvements, such as using consumption as a benchmark for household economic status and adjusting the assumed pass-through of carbon fee costs to households, based on recent research.
Conclusions
This study provides a useful look at how every congressional district does in unprecedented detail. Overall projections for how many households will receive more in dividends than the carbon costs they experience are approximately in line with previous estimates. This highlights the overall progressivity of the policy, in contrast to a regulations-only approach or a carbon tax that does not allocate revenue to households.
Study Highlights
- 61 percent of households and 68 percent of individuals in the U.S. end up receiving more than enough in monthly carbon dividends to offset their increased costs. Figure 1 shows how those net benefits break down across quintiles (each quintile = 1/5 of the U.S. population) ranked by household spending (consumption).
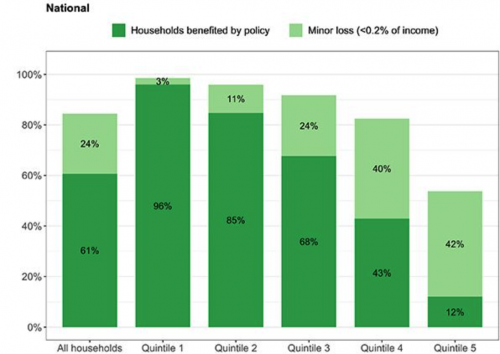
Figure 1. Percent of households whose carbon dividends exceed carbon costs, ranked by consumption quintile. The lighter green denotes a “minor loss,” defined as less than 0.2 percent of income (e.g., for a $50,000 income, less than $100 per year)
- The reason the policy favors poorer households is demonstrated in Figure 2.
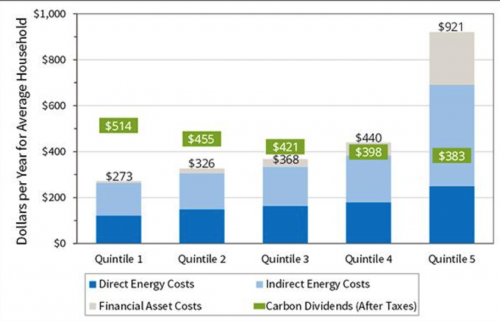
Figure 2. Comparison of Year 1 household costs from carbon fee with Year 1 carbon dividends. Direct energy is gasoline, electricity, and home heating. Indirect energy is embodied energy in all other purchases. Financial asset costs accrue from carbon costs incurred by businesses and passed back to owners. Carbon dividends are net after personal income tax.
Wealthier households (Quintile 5) have much higher carbon footprints. Thus, the policy places the financial burden upon those who contribute the most emissions, inherently relieving the most economically vulnerable households from bearing the burden for decarbonizing the economy.
- Figure 2 also shows that carbon dividends will exceed costs for the bottom three quintiles, with the fourth quintile roughly breaking even. Note that these carbon costs are determined by behavior, regardless of income. In the aggregate, those with higher incomes typically consume much more, but nothing in the policy prevents a household from making consumer choices that will reduce their pollution-related costs, if they are motivated to do so.
The study also illustrates results for other demographic groupings.
- Figure 3 shows how the net benefits work out according to race/ethnicity. Families of color experience, on average, more financial gains under this plan as a result of lower household spending (associated with lower carbon footprint), larger families (lower emissions per capita), and/or other community factors (e.g., more use of public transportation).
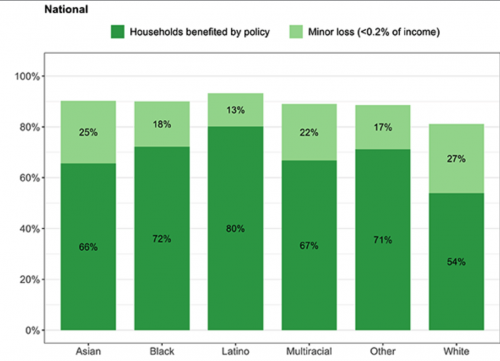
Figure 3. Percent of households whose carbon dividends exceed carbon costs, arranged by race/ethnicity.
- Figure 4 shows the results according to community type (rural vs. suburban vs. urban). Across the country, there are few differences in economic outcomes between rural and urban communities. In specific districts, the results will vary based on the community composition (e.g., a district that is predominantly urban or predominantly rural may show larger disparities due to limited data on households that fall into a different category).
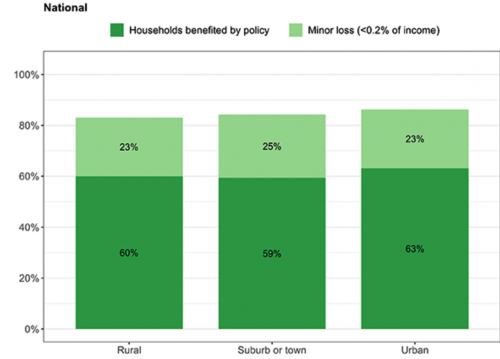
Figure 4. Percent of households whose carbon dividends exceed carbon costs, arranged by community type.
- Figure 5 shows the results according to age category. Older households tend to have smaller footprints, reflecting reduced mobility and consumption as a result of low fixed incomes. Younger households tend to be larger and are therefore benefited by the dividend formula, in addition to typically having lower early-career spending. As with the other charts, these outcomes reflect mainly economic status.
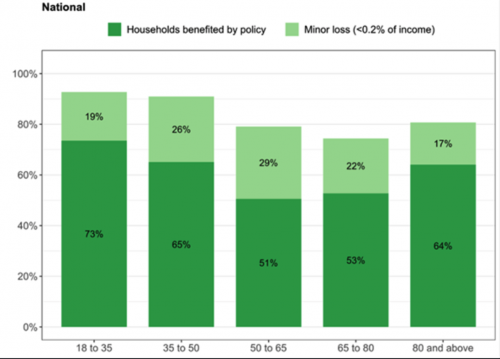
Figure 5. Percent of households whose carbon dividends exceed carbon costs, arranged by age category.
Improving Your Bottom Line
How can households reduce their carbon footprint, and thus either eliminate a net loss or increase their gain? There are many avenues for this, from more efficient transportation (e.g., public transit), more efficient living conditions (e.g., multi-family residence), and consumer choices that consider carbon footprint. This study did not allow for or anticipate any such changes in behavior, but they will become clear in the prices of competing goods and services. Of course, many carbon-reducing options (e.g., solar panels or electric cars) would be out of reach for families of modest means, which is why it’s important that their finances are protected even when they can’t afford such things.
Calculate the impact of Carbon Fee and Dividend on your budget.
About the Study
The purpose of the working paper was to respond to enduring interest from members of Congress in how their own constituents would fare under the Energy Innovation and Carbon Dividend Act (H.R.763). To complete that study, CCE and CCL commissioned Kevin Ummel, a Research Affiliate at the University of Pennsylvania, president of Greenspace Analytics, and author of a separate, earlier study estimating household financial outcomes under a carbon fee and dividend proposal prior to the introduction of Congressional legislation. Mr. Ummel had also completed a related study estimating household carbon emissions with zip-code level detail.
The analysis is limited to Year 1 and does not consider dynamic economic effects the policy would create over time. Pass-through of the pollution fee was considered under three scenarios: (1) 100 percent, which is a conventional assumption in most economic analyses; (2) 70 percent, based on a recent Georgetown University study revealing that pass-through varies by industry; and (3) 85 percent as a mid-range Baseline Scenario where the remaining 15 percent of carbon fee costs are passed back to capital owners. All scenarios assume the pass-through results in higher prices “overnight,” without changes in production or consumption in response to the price signal. Charts displayed here represent the results of the Baseline Scenario.
Intro & Background
(from beginning)
(2:25)
How Households Fare
(7:30)
Where To Find Resources
(11:31)
- Rick Knight
- View the Google Slides
- Download the Video
Intro & Background
(from beginning)
(1:11)
How Households Fare
(7:30)
Where To Find Resources
(11:31)
- Rick Knight
- Join the Economics Policy Network
- Household Impact Study Resources (including State/District Reports)
See all resources associated with Studies & Reports.