Weather Attribution Science
This training outlines the background behind attribution science -- the process of quantifying the contribution of global warming to extreme weather and other events --and this training discusses the process for how connecting climate change with extreme weather events is done, what it has found, as well as how we as CCL volunteers can employ effective communication in using its research and findings.
/topics/climate-change-science
What do we mean by extreme weather and attribution science?
Have you ever seen an interview on TV after an extreme weather event happens, where scientists are asked what the connection is to climate change? Often this is framed as “did global warming cause event x?” or “can we blame x on global warming?” and it has traditionally made scientists uncomfortable because it doesn’t fit with their complex and nuanced understanding, so they generally say “no, but ...” followed by complex and nuanced verbiage that the questioner doesn’t understand.
We know weather events are born from many factors, of which global warming is one. Additional elements that constitute weather include heat, drought, cold, precipitation, and wind and they are connected in complex ways. Heat in the ocean feeds energy to a tropical storm, which then becomes a hurricane. if it makes landfall, it can cause devastation through wind and precipitation. There are also secondary effects that we associate with weather, like the flooding after a big storm or wildfires, which are made more likely by heat and drought and exacerbated by wind.
Attribution is defined in scientific papers as “the process of evaluating the relative contributions of multiple causal factors to a change or event with an assignment of statistical confidence.” It must demonstrate that attribution is not opinion, but the outcome of rigorous analysis backed up by both science and data.
The questions that attribution science examines are:
- How is global warming, caused by the buildup of greenhouse gases in the atmosphere, connected to these events?
- Did it make the event(s) more likely?
- Did it make the event(s) more severe?
- If so, how much?
Who is doing attribution science?
Here are three prominent sources:
- The American Meteorological society (AMS). AMS publishes some attribution studies in their Bulletin of the AMS. They publish a special report on this topic each December for the prior calendar year.
- The World Weather Attribution project is a collaborative coordinated by Climate Central with partners at an Oxford institute, the Royal Netherlands Meteorological Institute, the University of Melbourne, and the Red Cross/Red Crescent Climate Centre.
The National Academy of Sciences publishes their work with the National Academies Press. The contributors from a 2016 Extreme Weather Events report included CCL Advisory Board member Admiral David Titley, who chaired the project and was formerly with NOAA.
How is it done?
The two major elements are:
- Observation of extreme weather events in the past, using historical data as much as possible.
- Simulation, using established scientific laws to calculate all the interactions and feedbacks, linking the past, present, and future.
Observation comprises the following key elements:
- changes in frequency of events
- changes in their characteristics, such as temperature, rainfall, duration, etc.
Simulations are different. Instead of tabulating observed data, they seek to predict outcomes based on physics and chemistry that is incorporated into supercomputer modeling.
These two methods must complement and strengthen each other. Neither one is sufficient by itself.
Observation and simulation are used to generate quantitative metrics such as Fraction of Attributable Risk (FAR). FAR is a way to express what the percent chance that the event will exceed some threshold was a result of global warming. For example, you could say something like “there is a 20% likelihood that this drought would not have occurred without global warming.” FAR turns out to be acceptable for some types of events, but not so great for others.
Another method is the Risk Ratio, which is sometimes called Probability Ratio. It is the ratio of the risk to pass up some threshold with global warming compared to the risk without it. For example, “global warming increased the risk of a drought of this severity by 20%.”
These methods may sound similar, but they’re mathematically different. The Risk Ratio has much wider application, but lacks the ‘causation’ framing that FAR provides. Let’s look at some examples:
There is also a distinction between two types of attribution: Conditional and Unconditional. These words refer to the type of modeling that’s used to quantify them.
- In unconditional modeling, all of the climate-related numbers -- like air temperature, ocean temperature, wind speed, and so on – are calculated by the model based on some initial conditions. Let’s say you start with baseline actual global conditions on January 1, 1950, and then run the model to see what it tells you to expect for mid-Atlantic hurricanes over all the years up to the present. You run the model with and without greenhouse gas buildup and compare that with what has actually happened.
- In conditional modeling, you would start with fixed values for certain key parameters, such as the sea surface temperature where a hurricane actually began. You would then run the model along the storm’s path with and without the anomalies created by global warming, and then see what the results are for the storm’s size and intensity.
Both of these could be used in attribution studies to answer different questions.
What have researchers found so far?
Scientists have now conducted climate attribution studies for dozens of individual extreme weather events. For a summary of some of these studies published in 2024, see CCL Research Coordinator Dana Nuccitelli’s Yale Climate Connections article on the subject.
An earlier example from a 2017 paper analyzed a deluge in Louisiana in August of 2016. They used the unconditional modeling approach with data going back to 1860 and ran six different models.
The left-hand chart shows the change in probability of the event, based on the risk ratio metric. The right-hand chart shows the change in intensity, meaning in this case the total rainfall.
They also computed a weighted average of the six models demonstrated by the added green dotted lines.
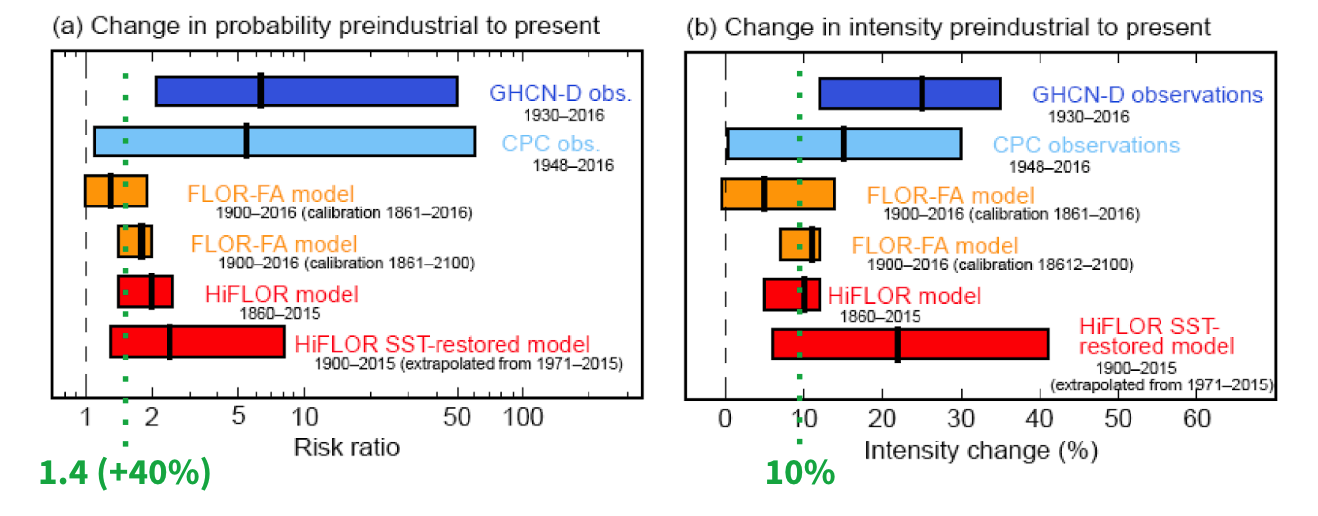
The averaged Risk Ratio was 1.4, which means that global warming increased the probability of such a flood by 40%. The intensity increase averaged out to 10%.
Given that these charts are hard to interpret by a general audience, here is how it was presented by NOAA online to make it clearer to everyone.

On the left it shows how the risk increased from global warming since 1900 in the average number of years between such events with a 40% increased risk.
On the right it shows how the amount of rain in a typical 3-day heavy rain event went up by 10% since 1900. Most of this change has occurred in the last few decades, and has accelerated.
What about hurricanes and tropical cyclones?
The southwestern US was battered by two massive storms in a two-week span in September and October 2024: Hurricanes Helene and Milton. Rapid attribution studies by several organizations estimated that climate change increased the precipitation from these storms by 10–50%, approximately doubled their destructive power, and made them about two-and-a-half times more likely to occur.
2015 was another brutal year for north pacific cyclones. NOAA scientists analyzed modeled data on North Pacific cyclone season energy scores going back to 1940, and then projected forward to 2050.

The “99th percentile” line represents the actual data from 2015 and the light blue area is the risk of exceeding that total energy. It means the chance of a wicked cyclone season like 2015 (or worse) will be five times higher in 2050 than it was in 1940.
How can we know how much an individual storm is affected by climate change?
That requires a highly conditioned analysis. For example, 2005 brought us Katrina, the deadliest hurricane of this century. A team from Virginia Tech, NOAA, and the Army Corps of Engineers studied how the flood levels from Katrina would have differed had it occurred in 1900. They considered global sea level rise, local subsidence and loss of wetlands (due in part to sea level rise) and storm intensity.
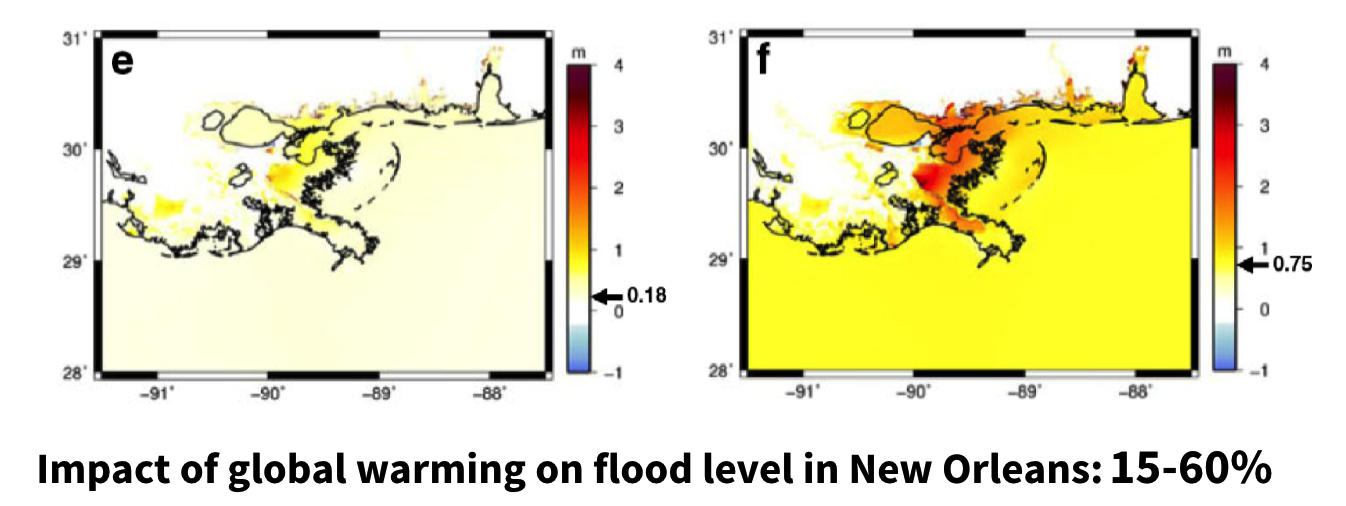
On the left is the effect of global sea level rise only, which accounts for 1 meter rise, not counting the local effect.
On the right, they also included the local changes in sea level which created between 2 and 3 meters higher flooding in the hardest-hit areas.
In terms of FAR numbers, they said flooding would have been 15 to 60 percent lower without the impact of climate change.
For more examples about extreme heat events and wildfires, click on the Watch or Listen tabs to hear CCL’s Research Coordinators Dana Nuccitelli and Rick Knight. For additional information visit World Weather Attribution, the National Academies, AMS, or NOAA’s Climate page.
How can CCL use this new approach?
A lot depends on the audience. It could be in a lobby meeting, or in a presentation, or at a tabling event. But regardless, here's some recommendations. When communicating with the public, feel free to include the following explanations:
- Every weather event, extreme or not, is affected in some way by climate change, and as long as we keep emitting greenhouse gases, that contribution will keep going up.
- No weather event ever has a single cause. There are always multiple factors, and one of them is global warming.
- Natural factors like the sun’s output, astronomical cycles, and shifting heat distribution in the oceans (the el Niño/la Niña cycles) average out over time, but global warming is different. As long as emissions keep going up, so will their contribution to extreme weather.
Framing recommendations
Although attribution findings are rightly expressed in statistical terms, these are hard for non-scientists to wrap their heads around. Basic scientific principles are more straightforward, so whenever possible:
- Emphasize the science over the statistics. Before citing probability-based results of an attribution study, it’s best to say something about the scientific basis for the connection. For example, when talking about a heavy downpour, remind your audience that global warming puts more water vapor into the air.
- Familiarize yourself with that underlying science for various event types, like the example above. When talking about drought, higher temperatures drive moisture from the soil. Warmer oceans feed energy into hurricanes. Long hot spells dry out vegetation, supplying fuel for wildfires, etc.
- When asked whether a recent event was “caused” by global warming, if a formal attribution study has not yet been published, a good way to respond is to say “We don’t yet know the extent of the effect.”
Get to know some benchmark examples of attribution for various event types, like heat waves, downpours, floods, droughts, cyclones, and so on. This will help you address questions about similar events even if they have not yet been thoroughly studied.
To skip ahead to a specific section go to the time indicated in parenthesis.
- (0:00) Intro & Agenda
- (3:37) What is Attribution Science and How Is It Done?
- (10:59) How Can CCLers Use This Knowledge?
- (15:43) More On Hurricane Helene and other 2024 Extreme Weather Events
- (35:55) What Can We Do About It?
- Rick Knight
- Dana Nuccitelli
- View or download Google Slides presentation
- Download the video
To skip ahead to a specific section go to the time indicated in parenthesis.
- (0:00) Intro & Agenda
- (3:37) What is Attribution Science and How Is It Done?
- (10:59) How Can CCLers Use This Knowledge?
- (15:43) More On Hurricane Helene and other 2024 Extreme Weather Events
- (35:55) What Can We Do About It?
- Rick Knight
- Dana Nuccitelli
Download this episode (right click and save).
Find the episode on CCL’s iTunes channel.
Join the Nerd Corner.
Instructions for printing this page on CCL Community.